My work

Each project shows what I enjoy most about working with data: experimenting, telling stories, and finding new ways to bring information to life.
 
My work has been shortlisted twice for the Sigma Data Journalism Awards, awarded the Gold (2023) and Silver (2024, 2025) Medals for Infographics and Interactive Design at the Indigo Design Award, and nominated for the European Press Prize in Innovation in 2023.

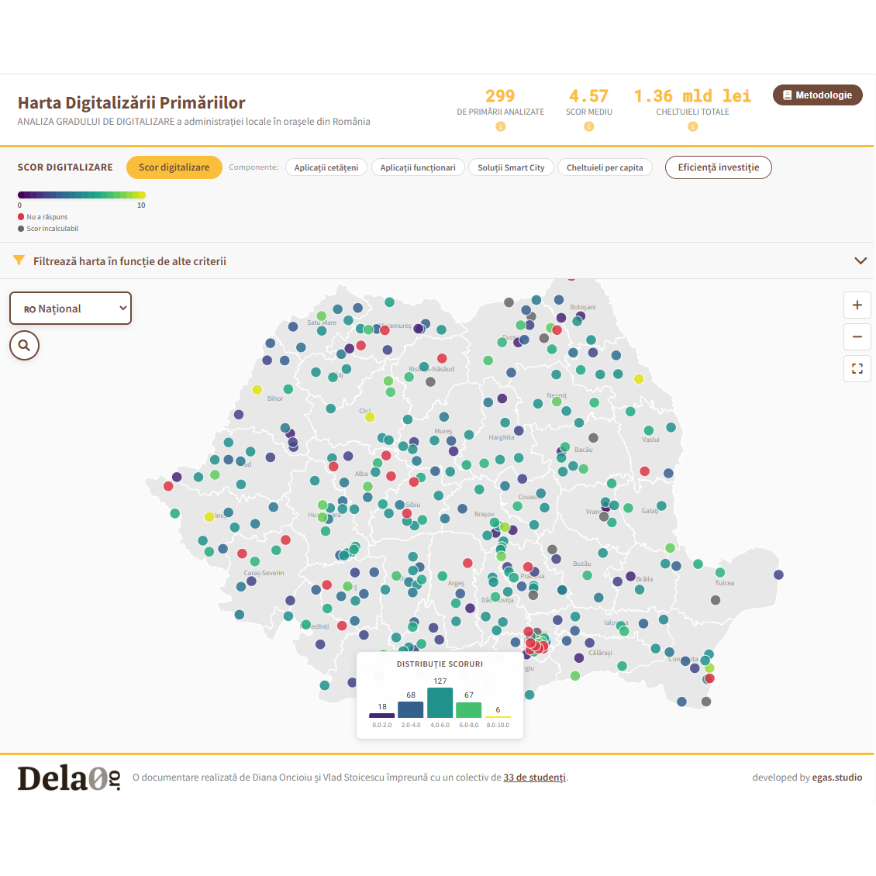
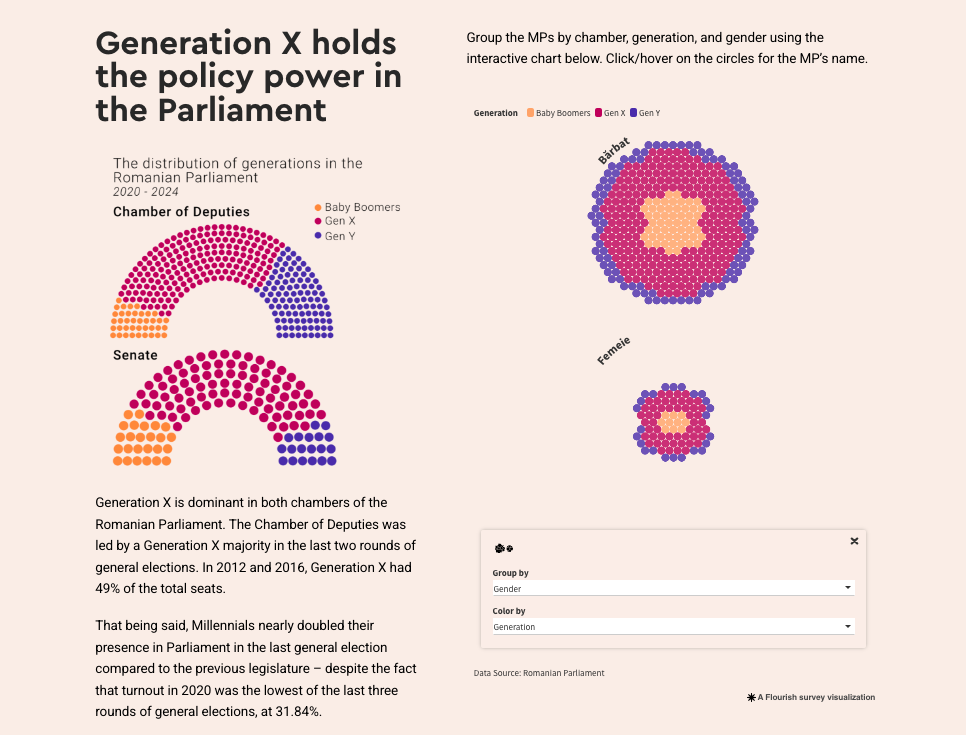
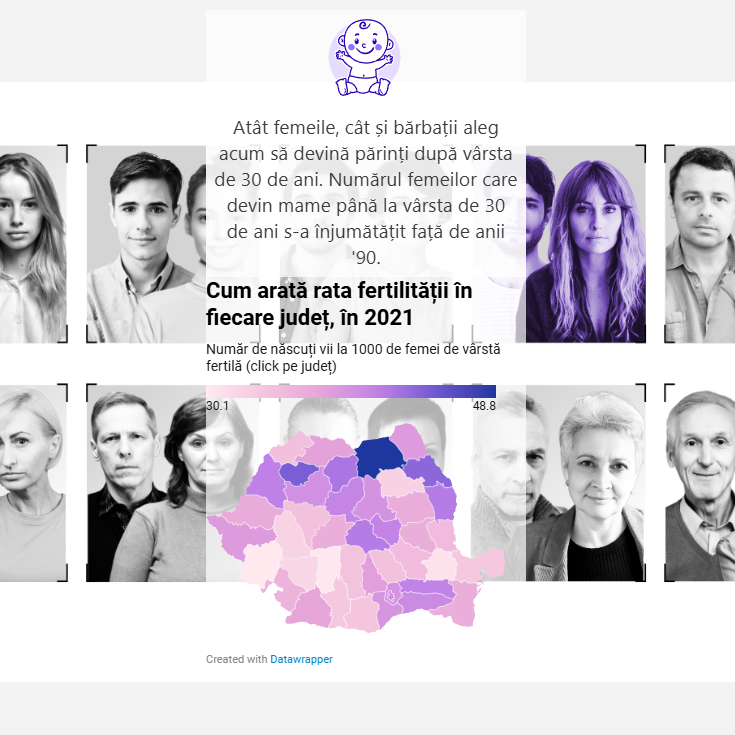
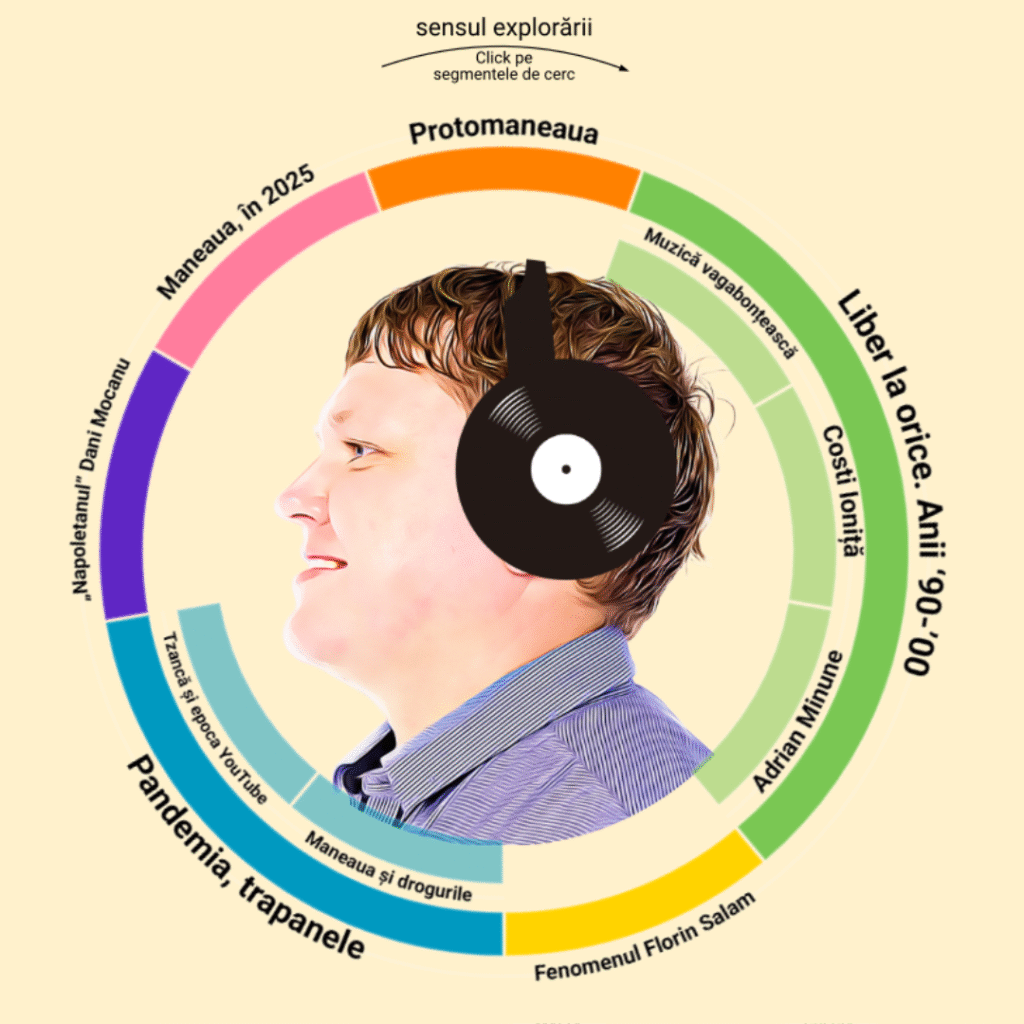
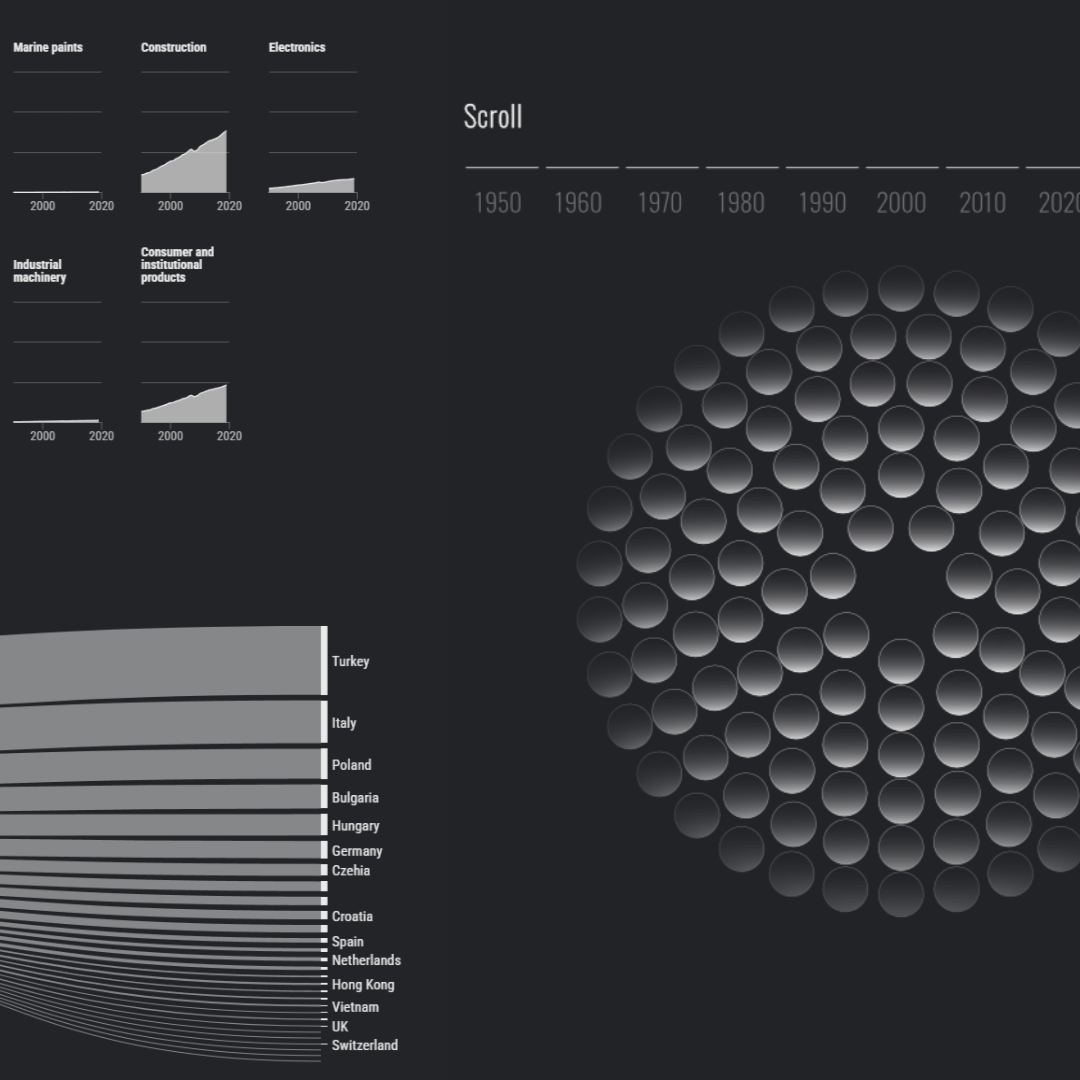
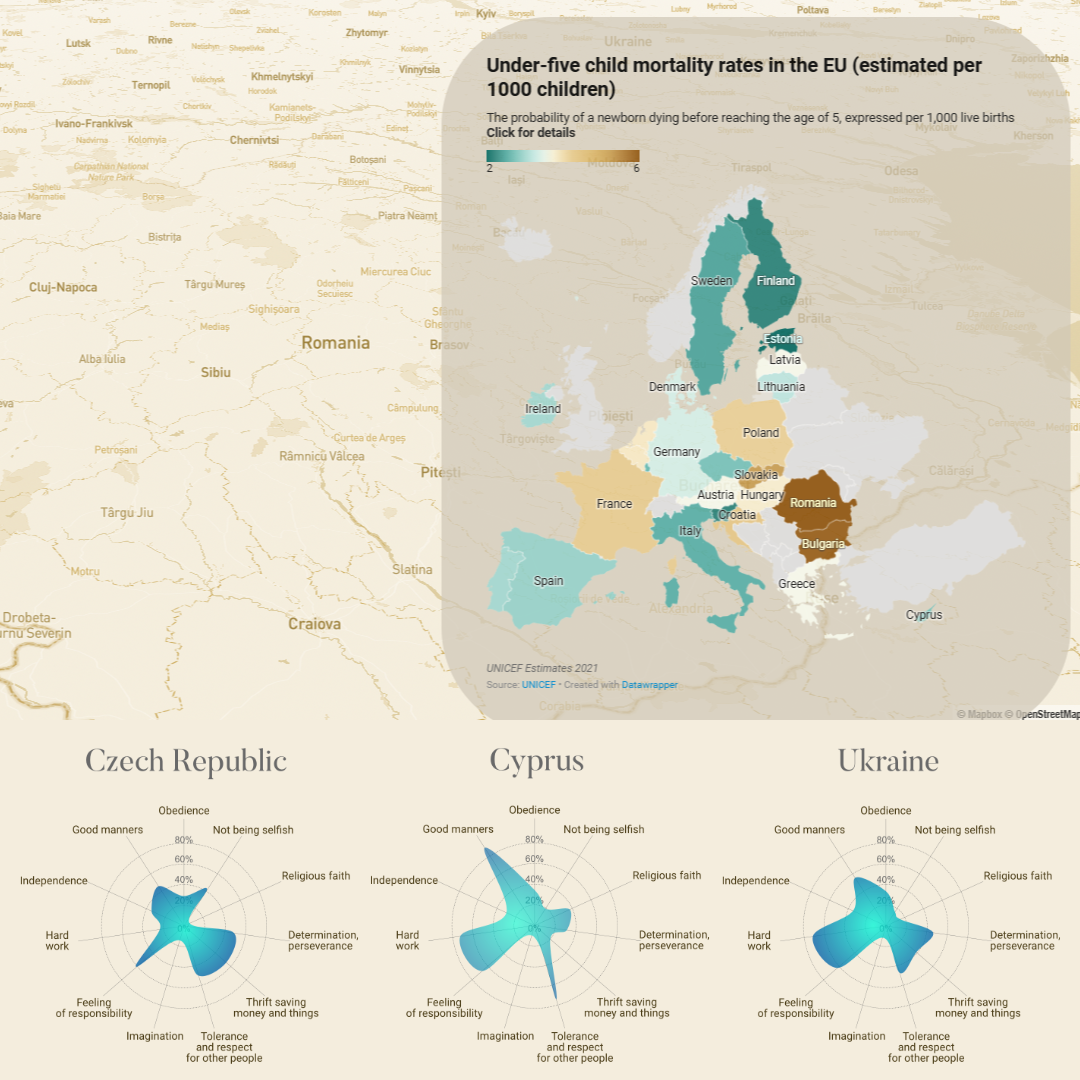
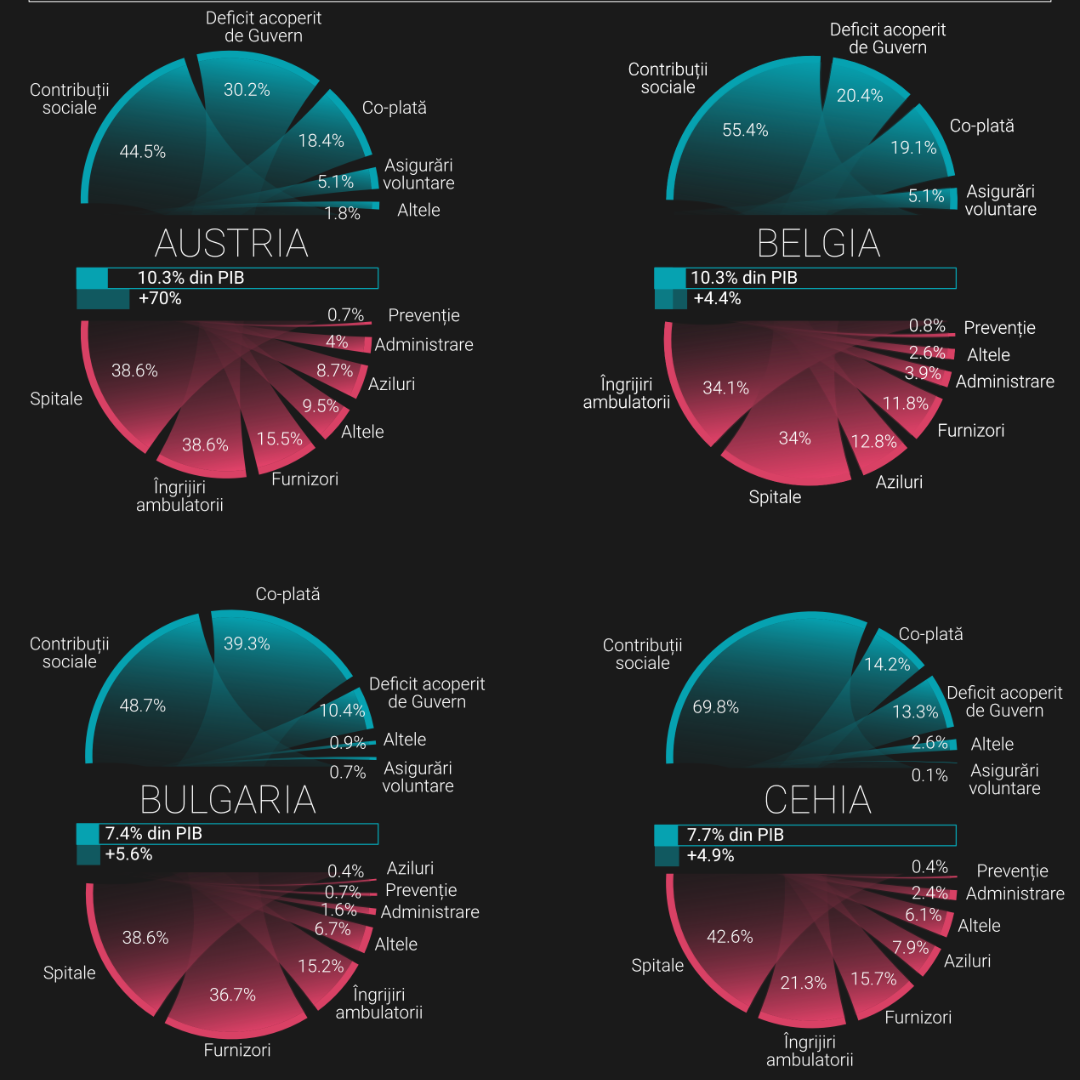
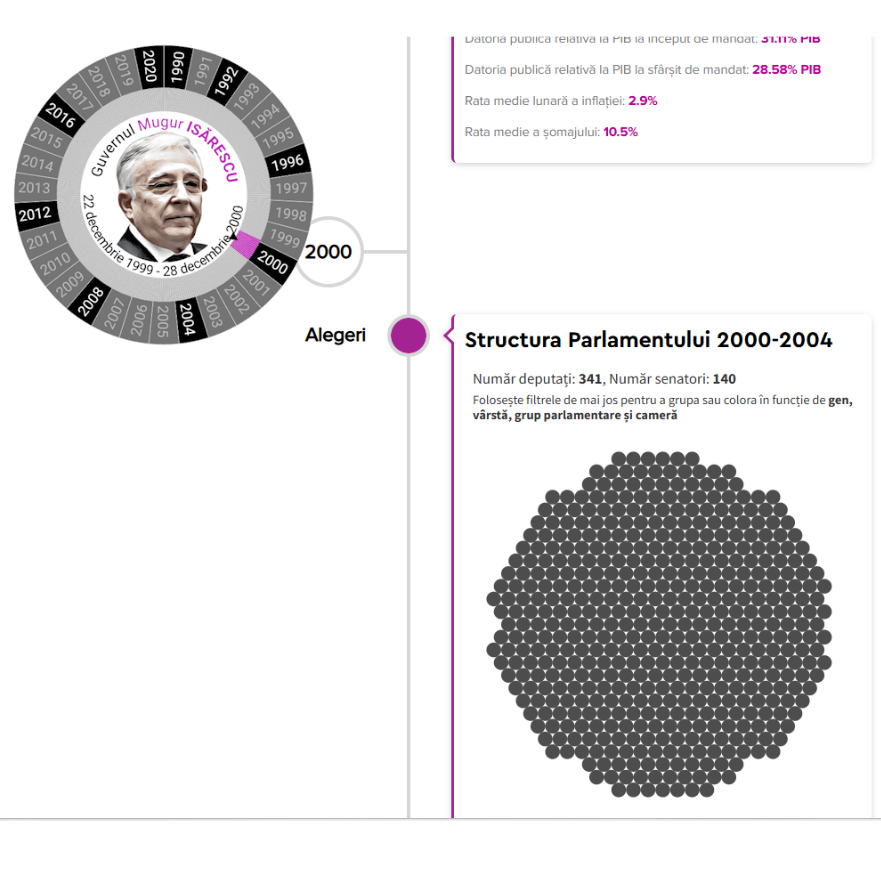
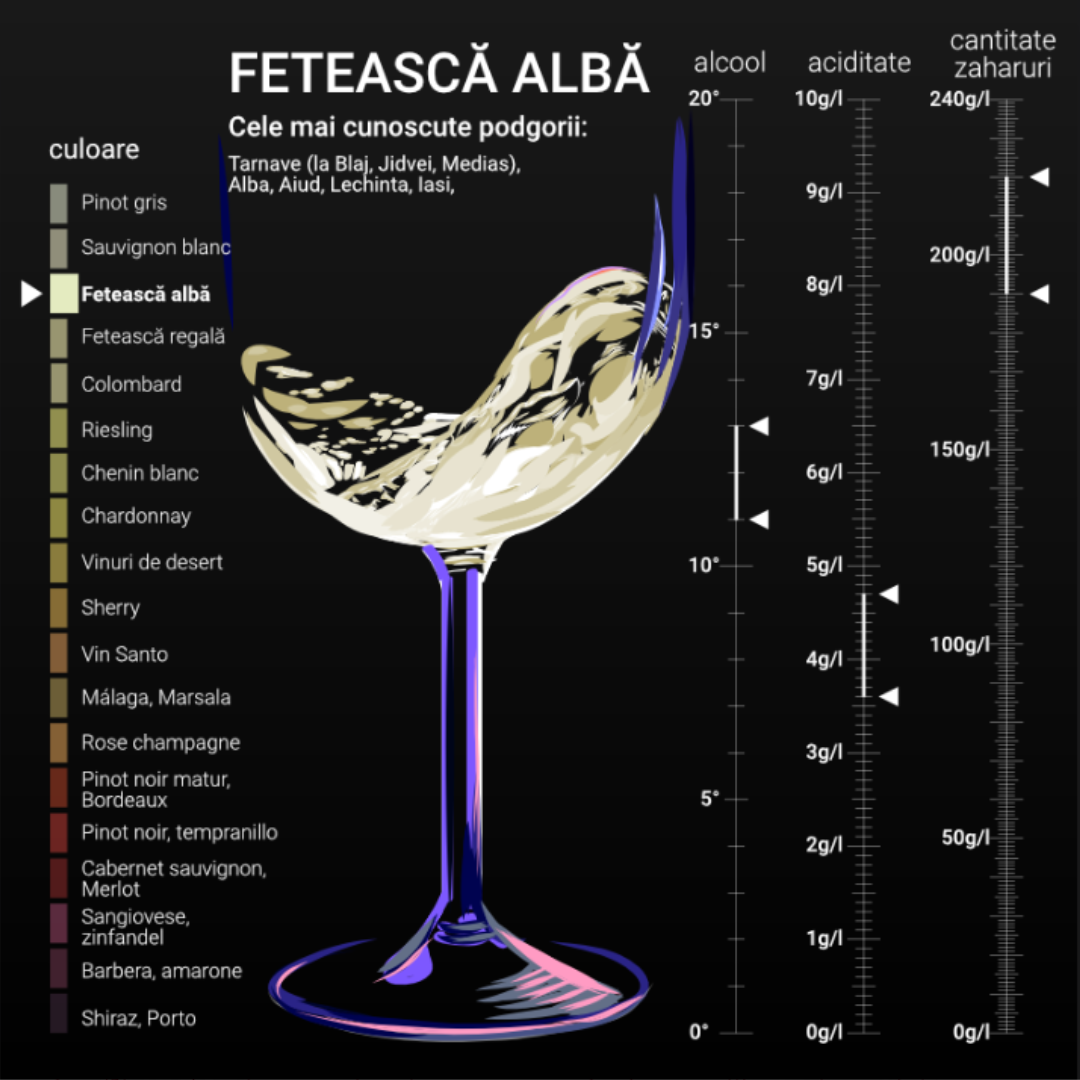
Explore a selection of my projects below, from static and interactive data visualizations. Click on any project to dive deeper into its dedicated page. If you’re curious about my creative process and latest updates, subscribe to my newsletter.

If you have a project in mind and would like to collaborate, feel free to reach out by email.

Fear of failure in Romanian entrepreneurship

The Golden Generation vs. The Soul Generation.

A Breakdown of Romania's Engines of Development

The digitalization map of Romanian municipalities

Generations of Romania: The demographic, political and economic power of each generation

What Does Your Life Look Like Now Compared to That of a Romanian of Your Age in the 90s?

The Social Phenomenon of Manele in Romania

The Electoral Universe of Romania

Map of Femicides in Romania

Mapping the Landscape of Over 300 Contemporary Women Artists

Visualizing the Mental State of the World

How the Housing Bubble Grew

Billionaires in the White House

The Electoral Atlas of Romania

The Atlas of leadership

The Journey of Plastic Through Romania

A world that no longer sees

After two years of warin Ukraine

How Would Your Child`s Life Story Unfold in a Different Country?

How much did the pandemic cost us?

Political history of Romania

Varieties of wine

Visualizing Exam Results

Romania's 44 Motions of No Confidence

The Electoral Atlas of Romania

Interactive Christmas recipe booklet

Generations of Romania: The demographic, political and economic power of each generation

Bridging Innovations - The Legacy of Romanian Inventors

Three Decades of Consumption-Based CO2 Emissions in Europe

Polymer Banknotes Around The World

Cats and Dogs in the US

On-Demand Abortions in the Private Sector

The Global Sock Market

The Sociology of Infertility

PETROL VS. DIESEL

Bytes vs. Bites: Countries Where 1GB of Mobile Data Is More Expensive Than 1 Loaf of Bread

Europe’s Trust Divide

High Blood Pressure Rates by Country

Youth Unemployment Trends Across Europe

The Cost of Living Around the World

A Long Life Isn't Always A Good Life

Generations Leading People - Heads of State By Age And Generation

Countries With The Most Bird Species

Banks in Our Lives

Visualizing Remittance Inflows to Romania

One Sheep for Every Two Romanians

The Cost of 9/11

Kids Who No Longer Go to School

My courses bring together the most valuable lessons I’ve learned over almost ten years of working with data. I share real use cases, practical scenarios, and the thinking behind each choice, along with the key lessons I rely on for storytelling, chart building, and visual logic. You’ll be able to use these skills in your daily life and work, whether you’re building dashboards, creating infographics, telling interactive stories, or simply tracking your own data to better understand yourself.

Back to Top
Back to Top
Close Zoom