Fear of failure in Romanian entrepreneurship

2021

________

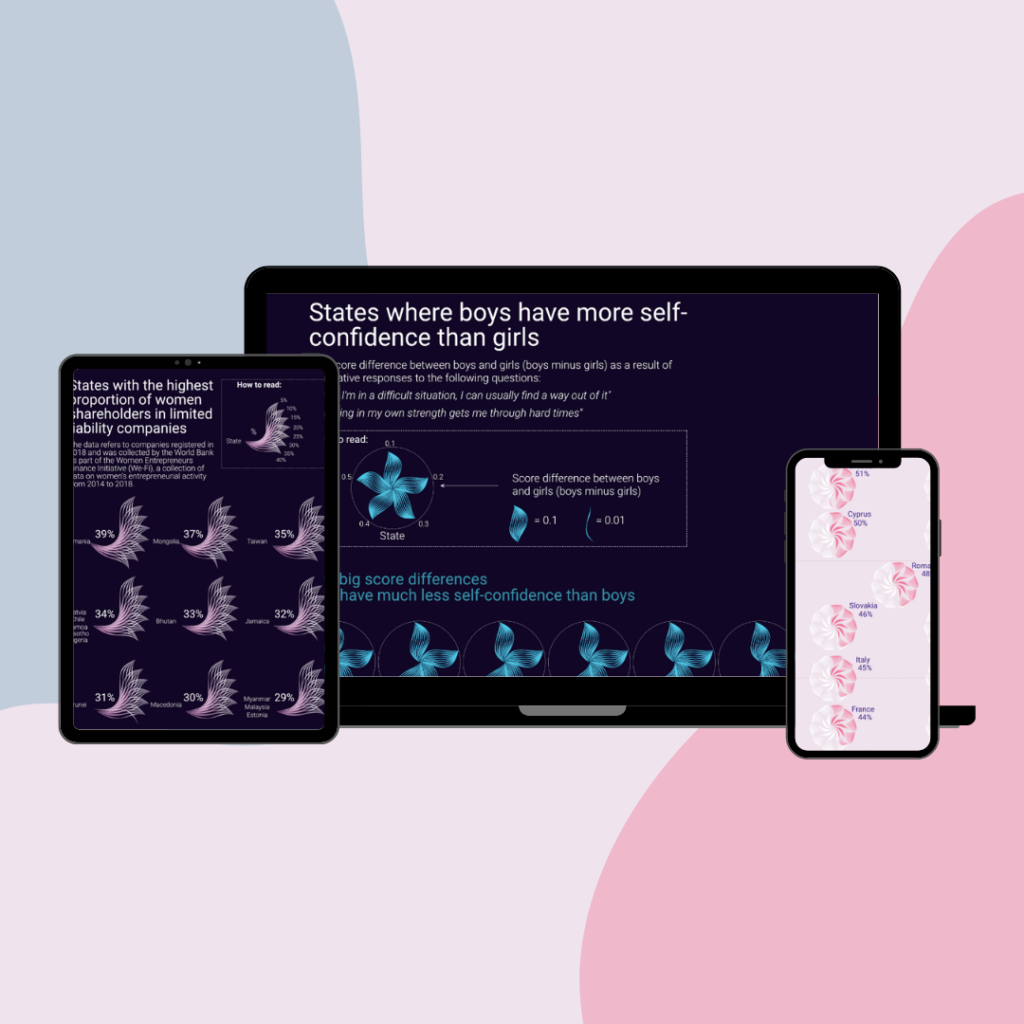
Tools: Affinity Designer, Flourish, Microsoft Bing Image Creator
Client: Panorama
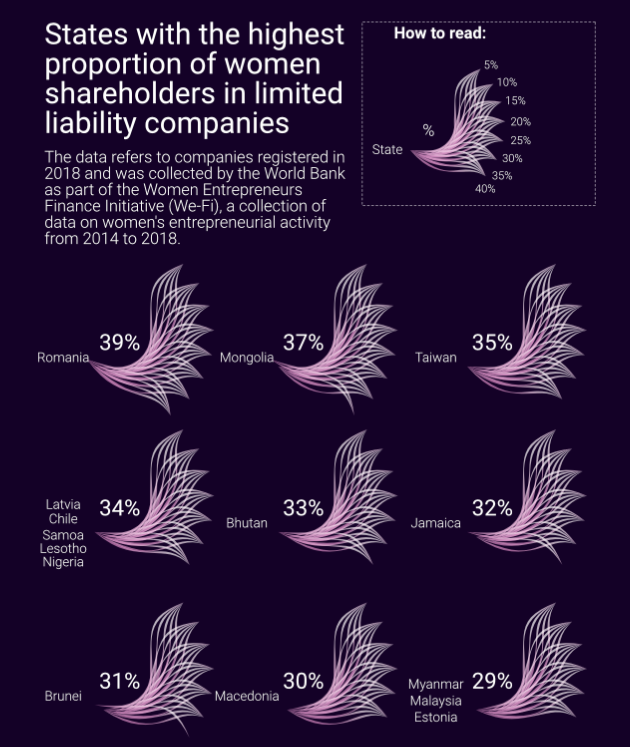
Data: Global Entrepreneurship Monitor, National Trade Registry Office 2021, OECD 2018, PISA tests 2018, Science Advances.
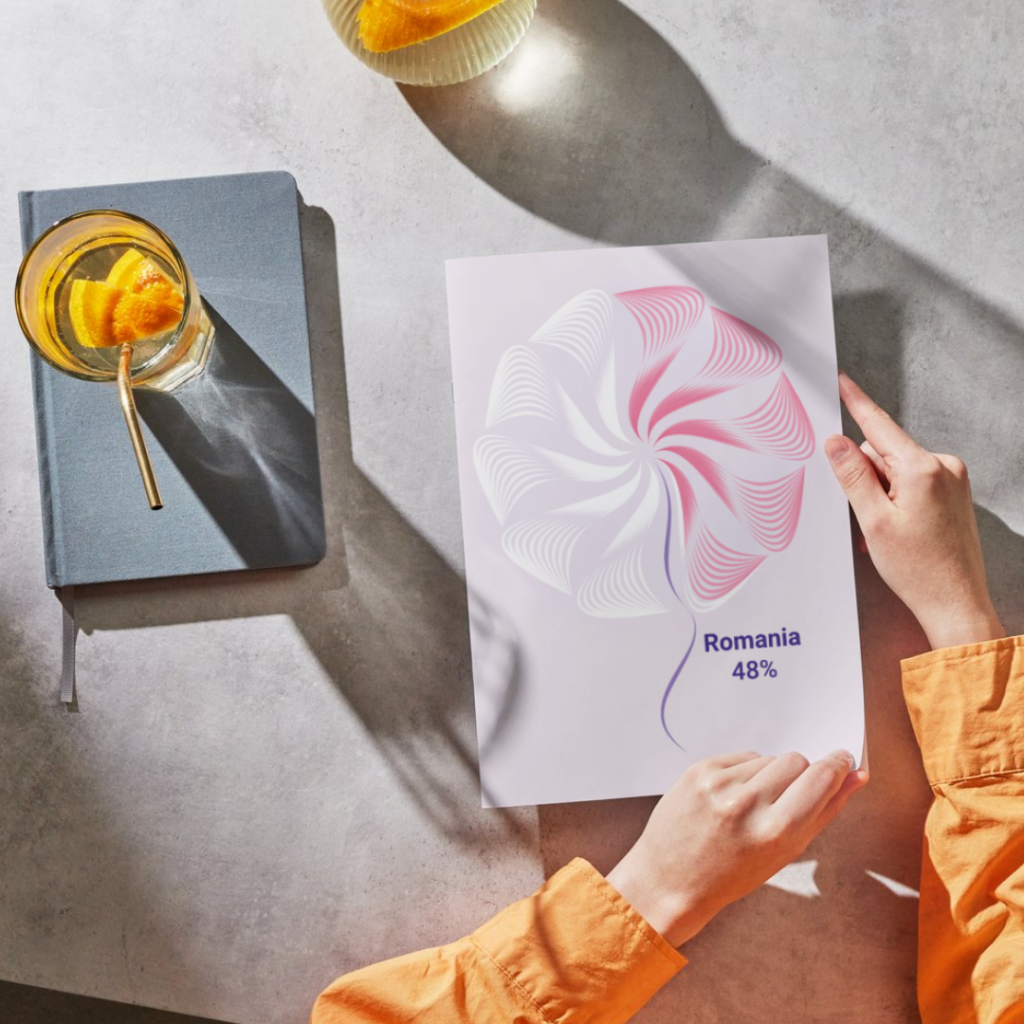
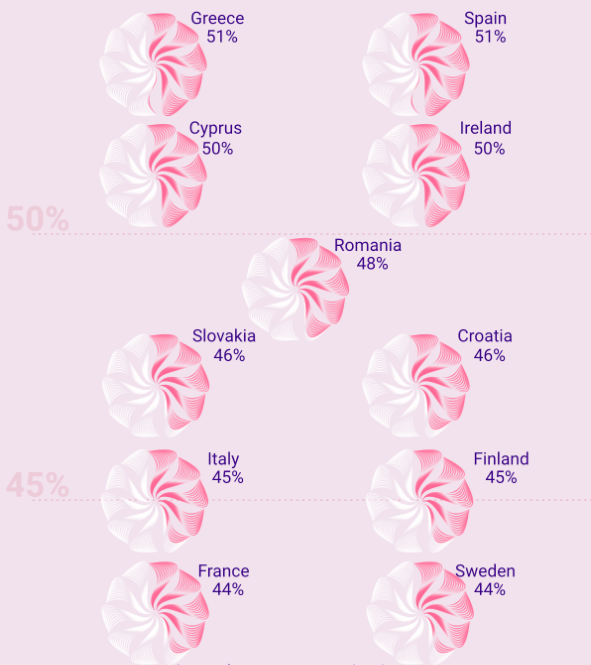
Link: Fear of Failure in Romanian Entrepreneurship
Color palette:

Of all the visualization projects I’ve worked on, this one is one of my favorites.
 
The project started with a bold statement: “Girls believe that failure is caused by their inability, while boys attribute failure to external causes.” This idea sparks strong opinions right away. I wondered how to visualize something so abstract and debated. That question drove me to take on the challenge.
 
I designed petal-shaped visuals and chose the colors with care. Could a basic scatter plot have shown the same information more simply?
 
What if I had just written an article with plain text and simple scatter plots? I doubt it would have engaged readers as much as the petal visuals did.
 
In my view, data visualization is also about choosing what power to give your readers. I wanted to invite them to explore, not just watch from the sidelines.