What Do the Numbers Say About the Generation That Took the 2022 Baccalaureate?

2022

________

Tools: Python, Leaflet, Carto, Elementor. Flourish
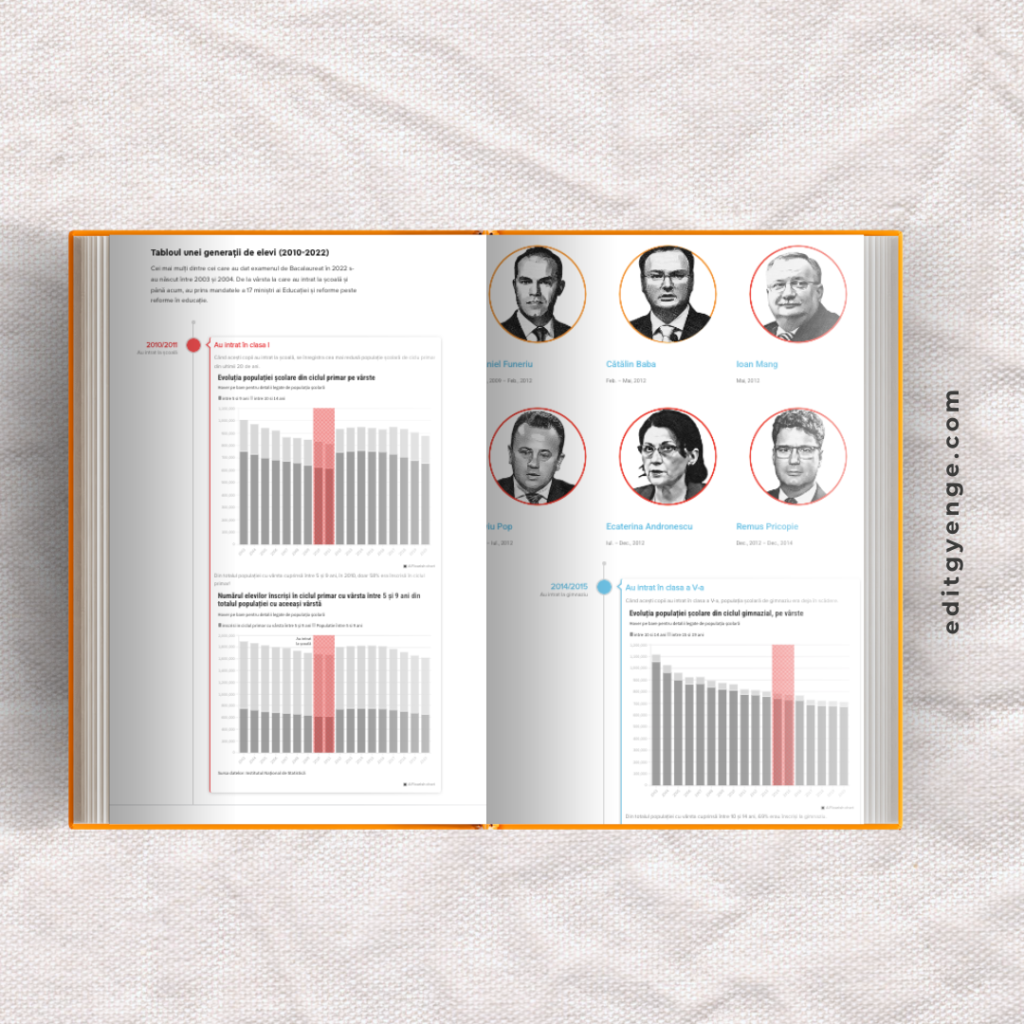
Client: Panorama
Data: National Institute of Statistics, Ministry of Education, Data.gov, Wikipedia
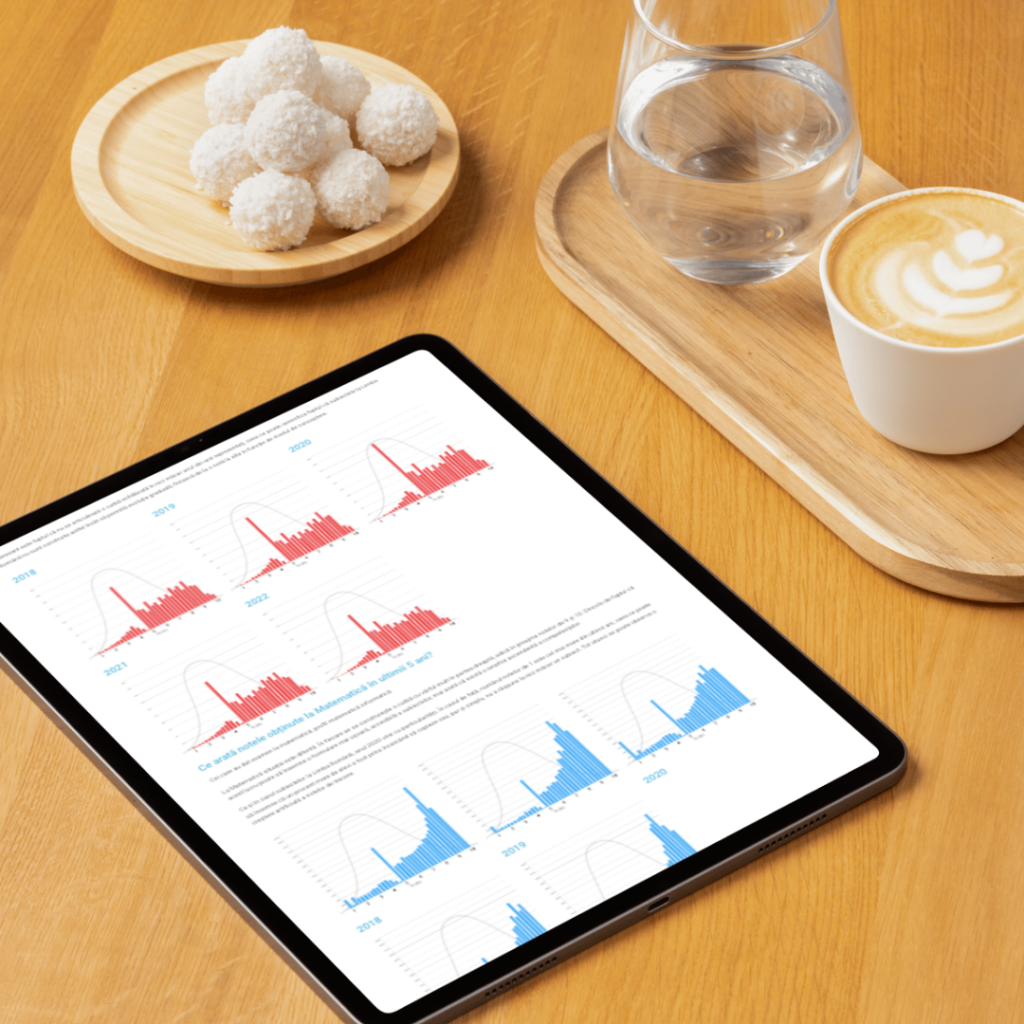
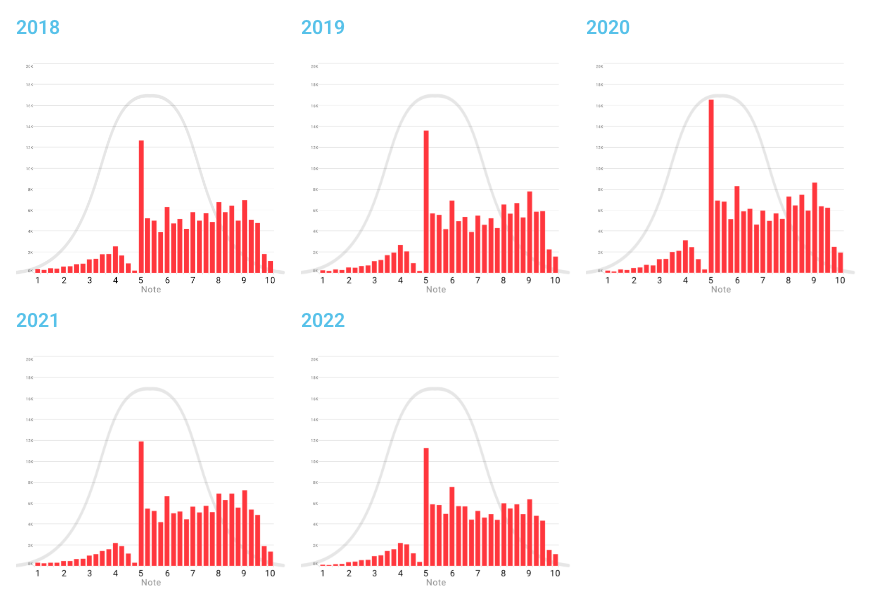
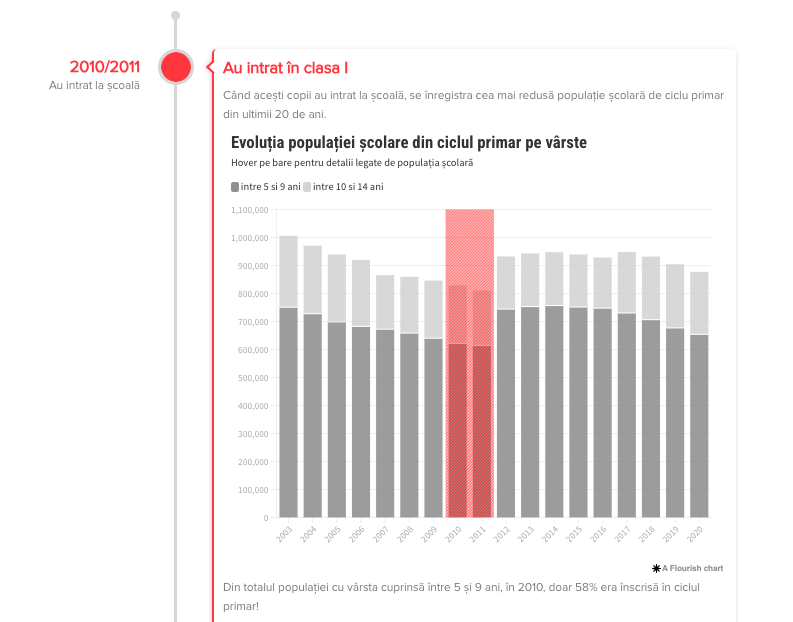
Link: What Do the Numbers Say About the Generation That Took the 2022 Baccalaureate?

Color palette:

In Romania, the Baccalaureate exam is a major milestone for 12th-grade students and reflects the state of the whole education system, including teachers, schools, and policies. However, each year, the public only sees basic county-level pass rates, so many important details remain hidden.
 
This project aimed to change that. Rather than seeing Baccalaureate data as just a final result, I used it to look more closely at how our education system really works.
The project had two main parts:
  • Contextual Analysis: I looked at the 2022 results and compared them with previous years, studying trends in different subjects. I also used Gaussian distribution analysis to see if the score patterns matched normal statistical curves or showed signs of other influences in the system.
  • School-Level Visualization: To go beyond general averages, I made an interactive map of major cities. For each school, I created coxcomb charts that show how student grades are spread out (9–10, 8–9, and so on). This tool lets people search for schools or explore the city, making it easy to compare schools and neighborhoods and see detailed results at the local level.
By turning raw exam results into clear and useful insights, this project encourages a deeper and more thoughtful look at Romanian education, recognizing the complexity behind the numbers.