Tools: Affinity Designer, Flourish Studio, animated video made with Claude code Client:Infoclima.ro Data: Interpretările EPG pe baza datelor Transelectrica Link:De ce se stinge lumina în România? Color palette:
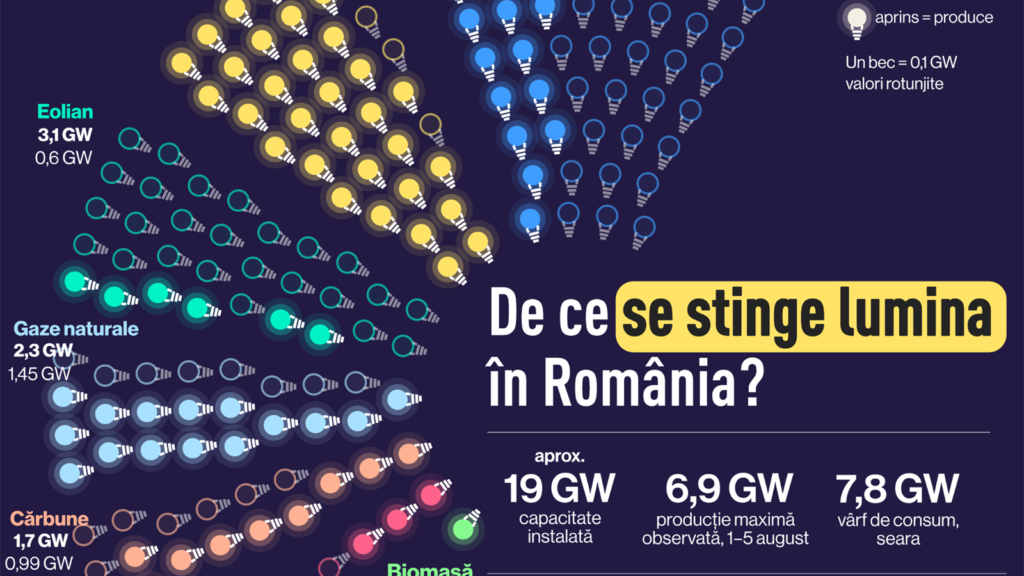
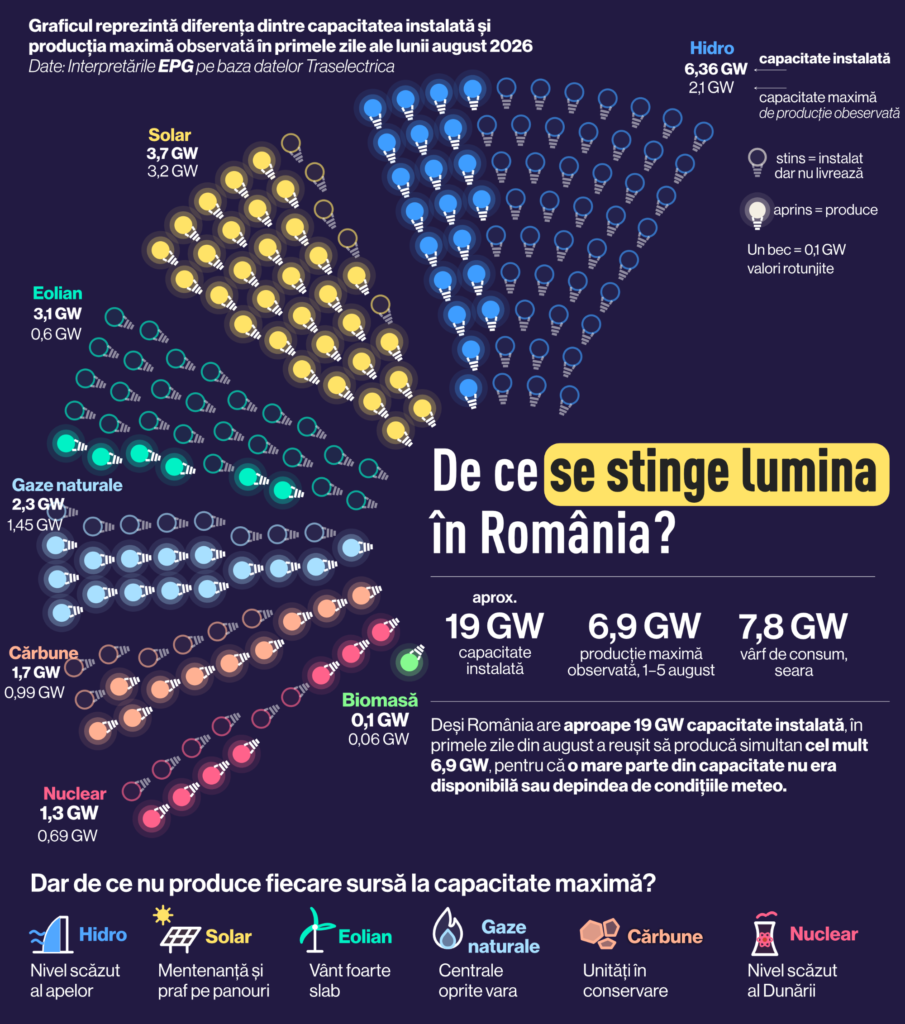
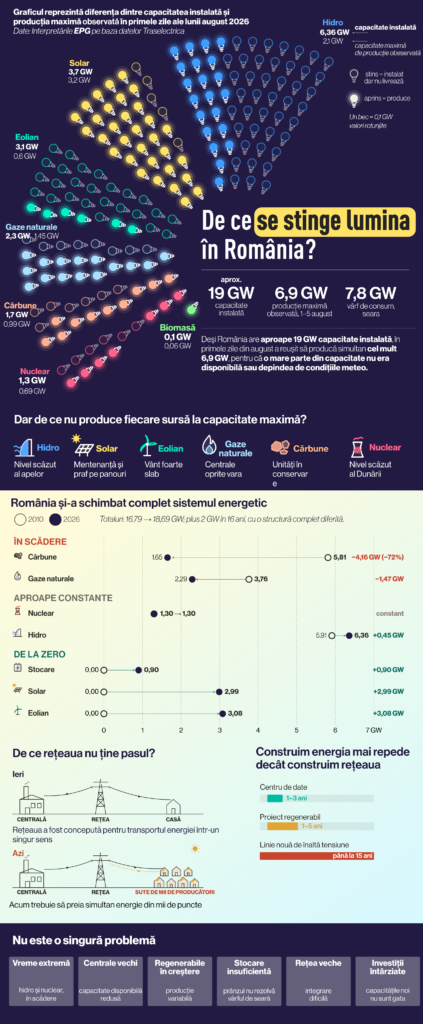
This project explores why Romania’s power system struggles to meet demand despite having almost 19 GW of installed capacity. In early August 2026, only 6.9 GW was producing at peak, while evening demand reached 7.8 GW.
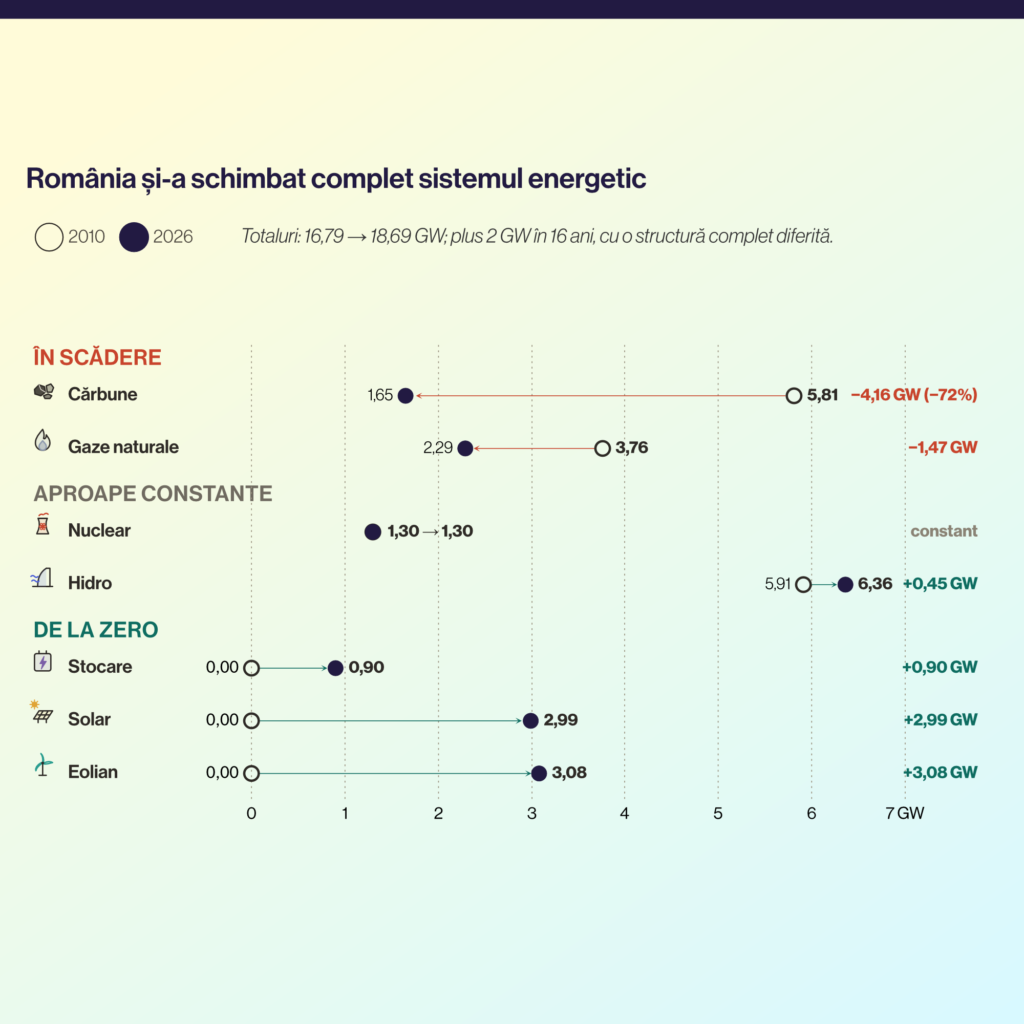
I turned that gap into something you can count: each light bulb represents 0.1 GW. Lit bulbs show capacity actually producing; dark ones show capacity that exists but wasn’t delivering. The rest of the infographic builds around this central idea, showing why different energy sources fall short and how Romania’s energy mix and grid have changed since 2010.
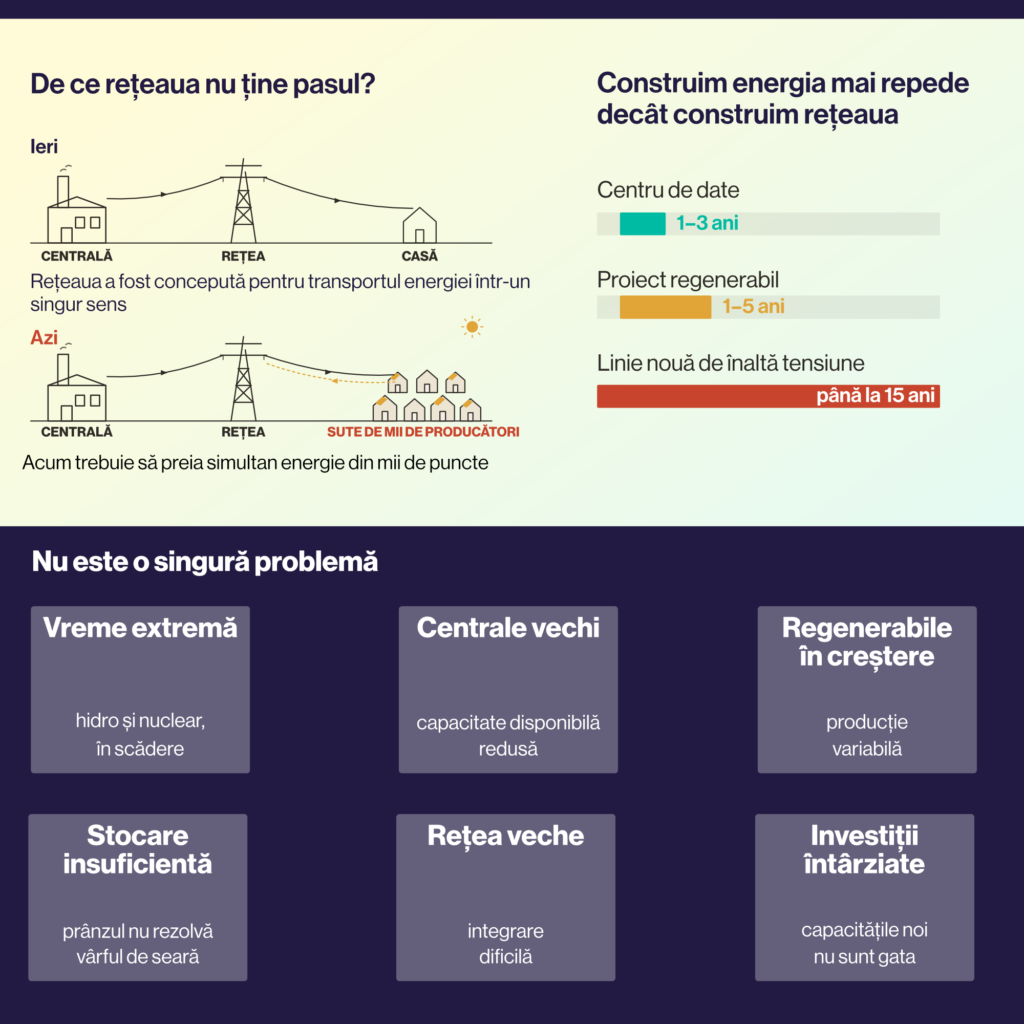
Rather than explaining all the causes at once, the story unfolds in layers: first the gap, then the reasons behind it, and finally the larger structural changes behind the problem.