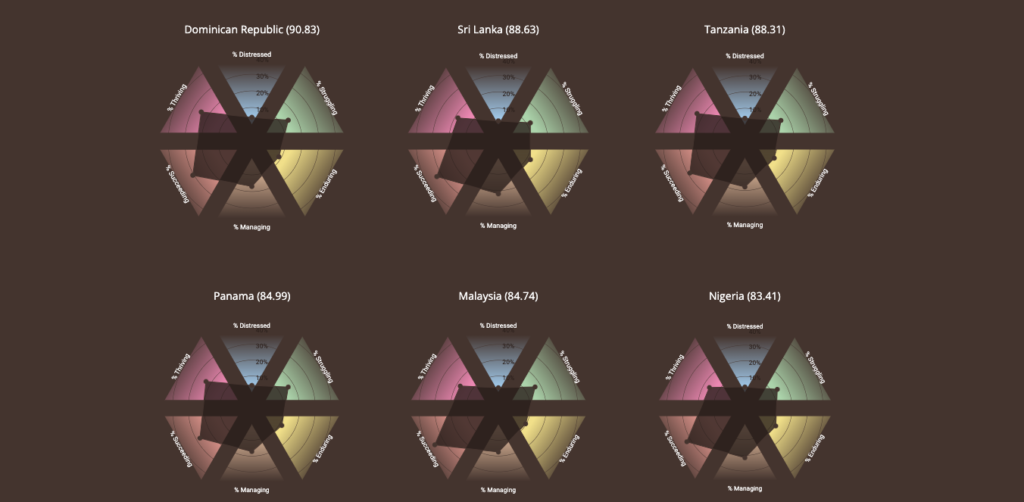
I started this personal project by experimenting with different ways to map data. Instead of using traditional heat maps or choropleth maps to show mental health indicators, I aimed to create a unique experience for each country. This lets viewers explore patterns and highlights what makes each nation’s situation unique.
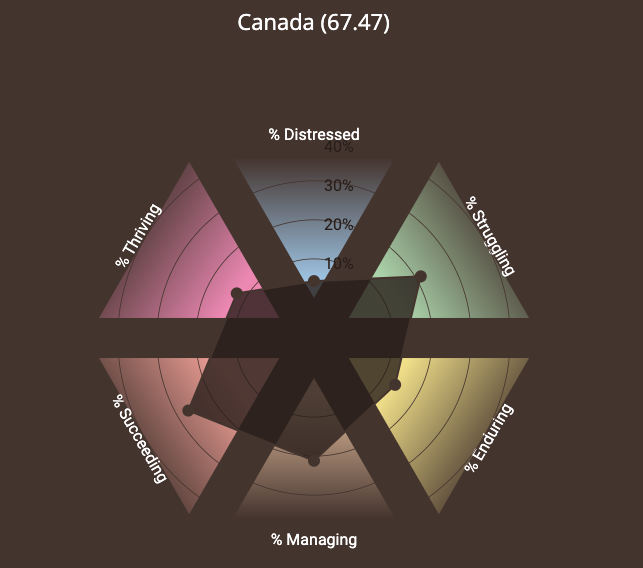
The visualization uses small multiples of spider charts, so each country has its own profile. I have always liked this technique because it keeps each country’s individuality while making it easy to compare them. This format encourages curiosity, as people often look for their own country first before exploring regional or global patterns.