A Century of Plastic

The Journey of Plastic Through Romania – Where It Comes From, Where We Send It, and How Much Stays Here

2023

________

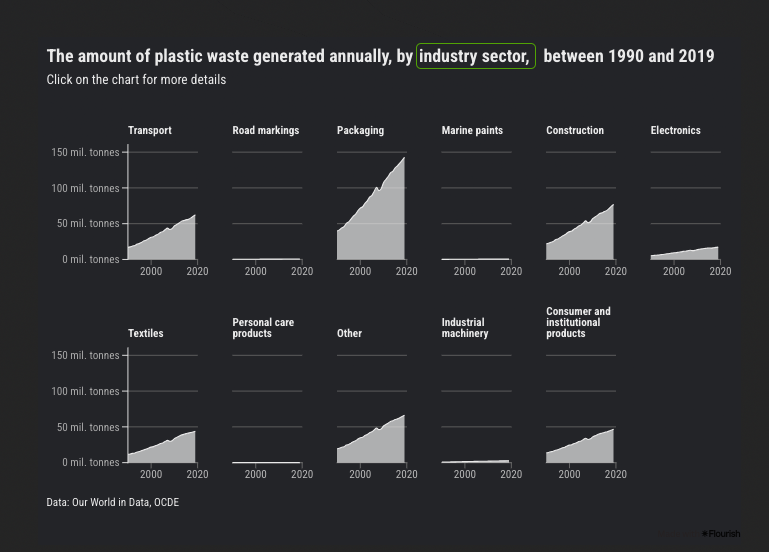
Tools: Flourish, Affinity Designer
Client: Panorama
Data: Eurostat, The World Bank, UN Comtrade Database, Our World in Data.
Link: The Journey of Plastic Through Romania – Where It Comes From, Where We Send It, and How Much Stays Here
Color palette:

This project came out just as Romania was introducing the Deposit-Return System (SGR). At that time, people needed clear and accessible information about plastic production, waste management, and environmental impact. Instead of using dramatic revelations, the project focused on helping people understand this important policy change.
 
I created this visualization to explain data in a way that teaches and informs. The interactive features let users see how plastic production has changed over time, both around the world and in Romania. By comparing different regions and countries, the visualization helps people understand the current situation and what the future of plastic waste might look like.
 
Not every visualization project needs to use new techniques or surprise people with its style. This project is about making things clear and raising awareness. With so much alarming news about global warming and environmental damage, this visualization stands out by simply explaining why small actions from individuals matter in the bigger picture.
 
The design choices support this goal by focusing on accessibility and clarity instead of innovation or artistic style. Every part of the visualization is meant to help users understand how the plastic cycle works and what they can do to make a difference.