Ukraine War infographic

After Two Years of War in Ukraine

2024

________

Tools: Mapbox, D3.js, Microsoft Bing Image creator
Client: Panorama
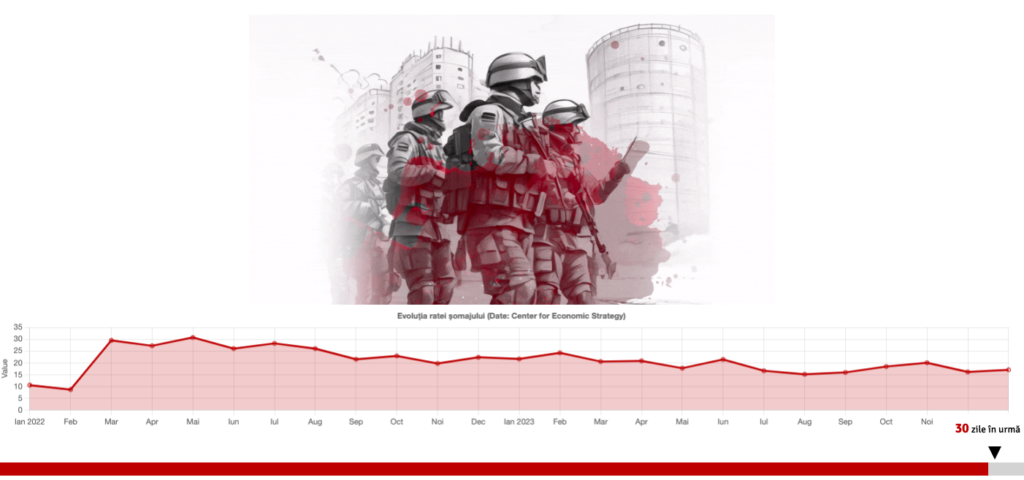
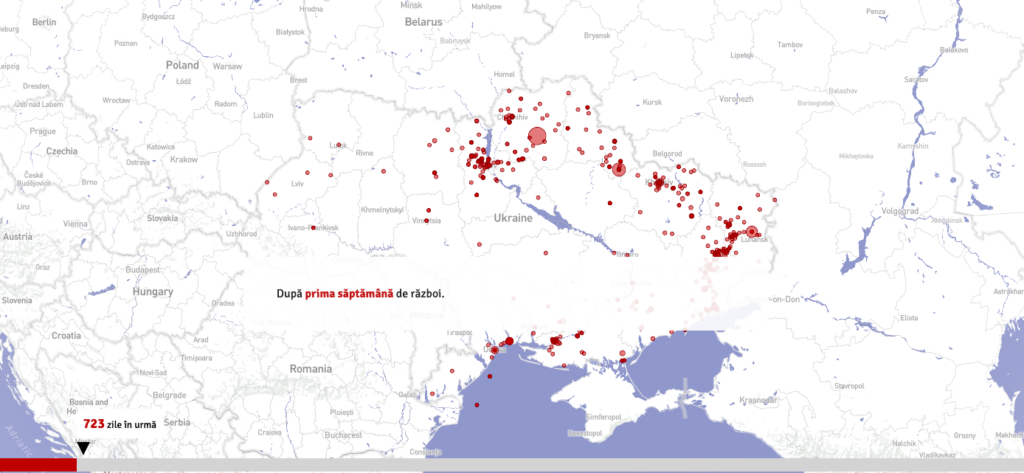
Data: information obtained with the support of Victoria Kopenko for material published in Panorama, Center for Economic Strategy, Armed Conflict Location & EventDataProject (ACLED), acleddata.com, Ukrainian Nature Conservation Group, Financial Times, Washington Post, WWF, BBC, World Bank, Studies: Zalakeviciute, R.; Mejia, D.; Alvarez, H.; Bermeo, X.; Bonilla-Bedoya, S.; Rybarczyk, Y.; Lamb, B. War Impact on Air Quality in Ukraine. Sustainability 2022, 14, 13832. https://doi.org/10.3390/su142113832, Shumilova, O., Tockner, K., Sukhodolov, A. et al. Impact of the Russia-Ukraine armed conflict on water resources and water infrastructure. Nat Sustain 6, 578-586 (2023). https://doi.org/10.1038/s41893-023-01068-x
Link: After Two Years of War in Ukraine (RO)
Color palette:

How can you show ongoing tragedy in a visual way? What can a visualization really say about a country at war, where people die every day, families are split apart, communities are destroyed, and millions are left traumatized? I started this project with deep humility, knowing that no visualization could ever capture even a small part of the real humanitarian and environmental disaster happening in Ukraine.
 
The visualization shows several sides of how Ukraine has changed since the Russian invasion. It covers the humanitarian crisis, destroyed infrastructure, economic losses, and the environmental damage that is often ignored.
 
The project was meant to give a voice to those who could not speak for themselves by recording what has been lost.
 
I made a timeline that compares Ukraine before and after the invasion. This simple approach helps show just how much has been destroyed. The visualization avoids exaggerating the tragedy but still shows how serious it is.
 
The second part of the project looks at the environmental impact, which is a crucial but often ignored part of war. It shows the effects on biodiversity, farming, water pollution, and the air.
mockup ukraine war infographic
Ukraine War infographic
mockup ukraine war infographic