________
Tools: Affinity Designer, Flourish
Client: Panorama
Data: National Institute of Statistics, Romanian Parliament, National Trade Registry Office, Our World in Data,
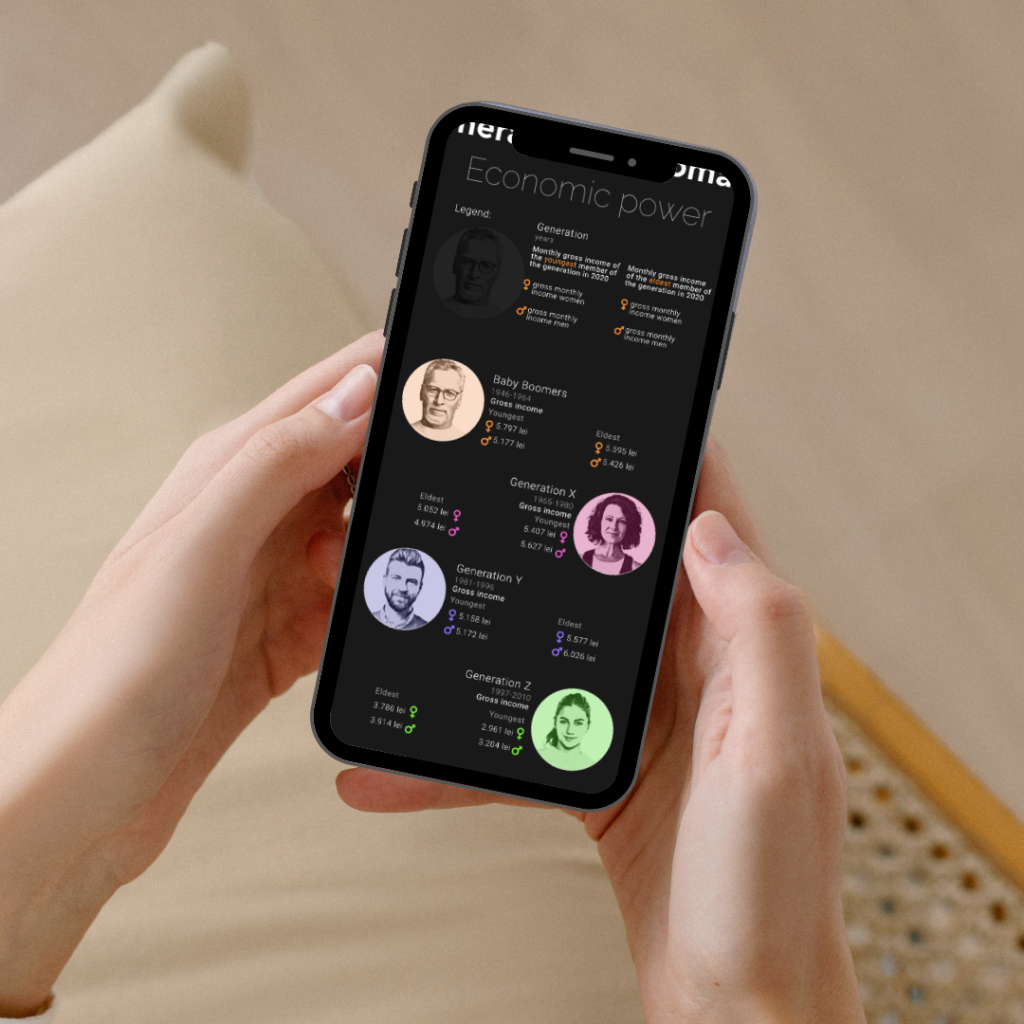
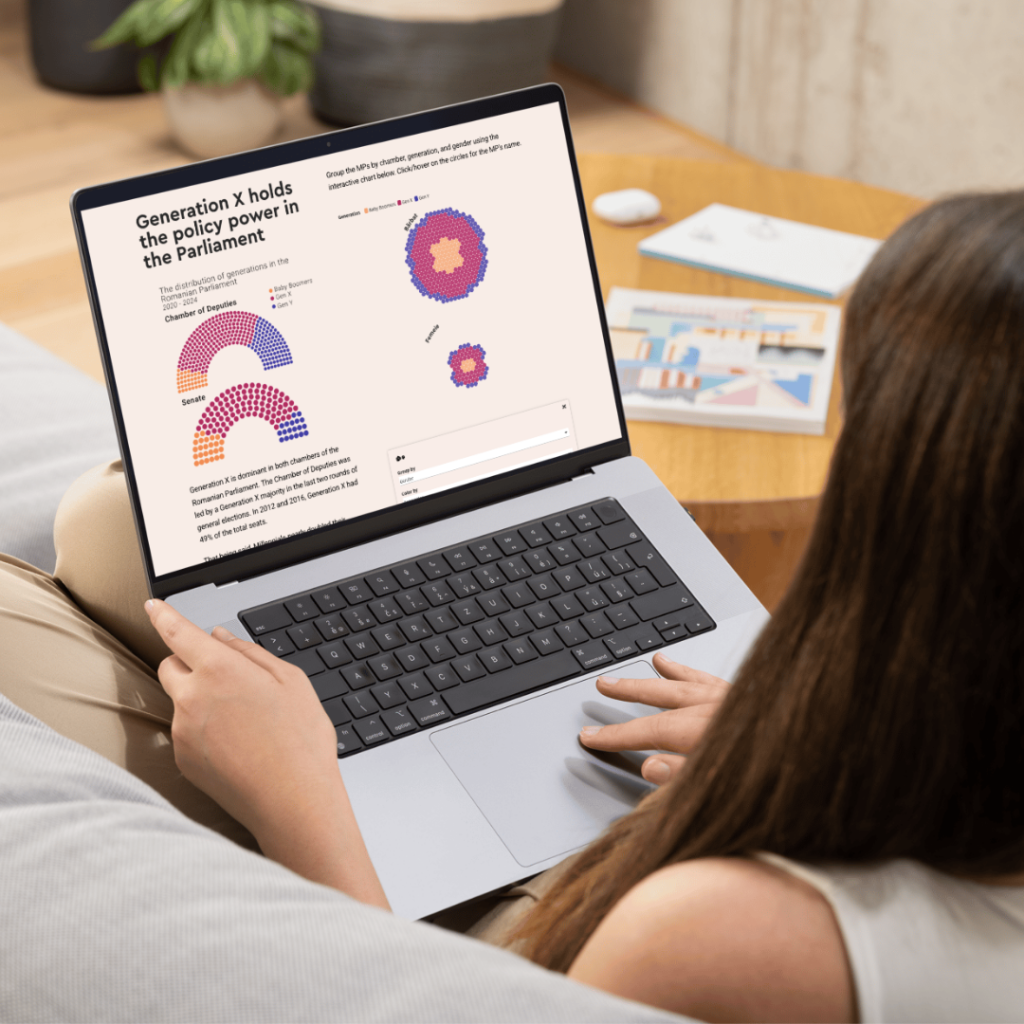
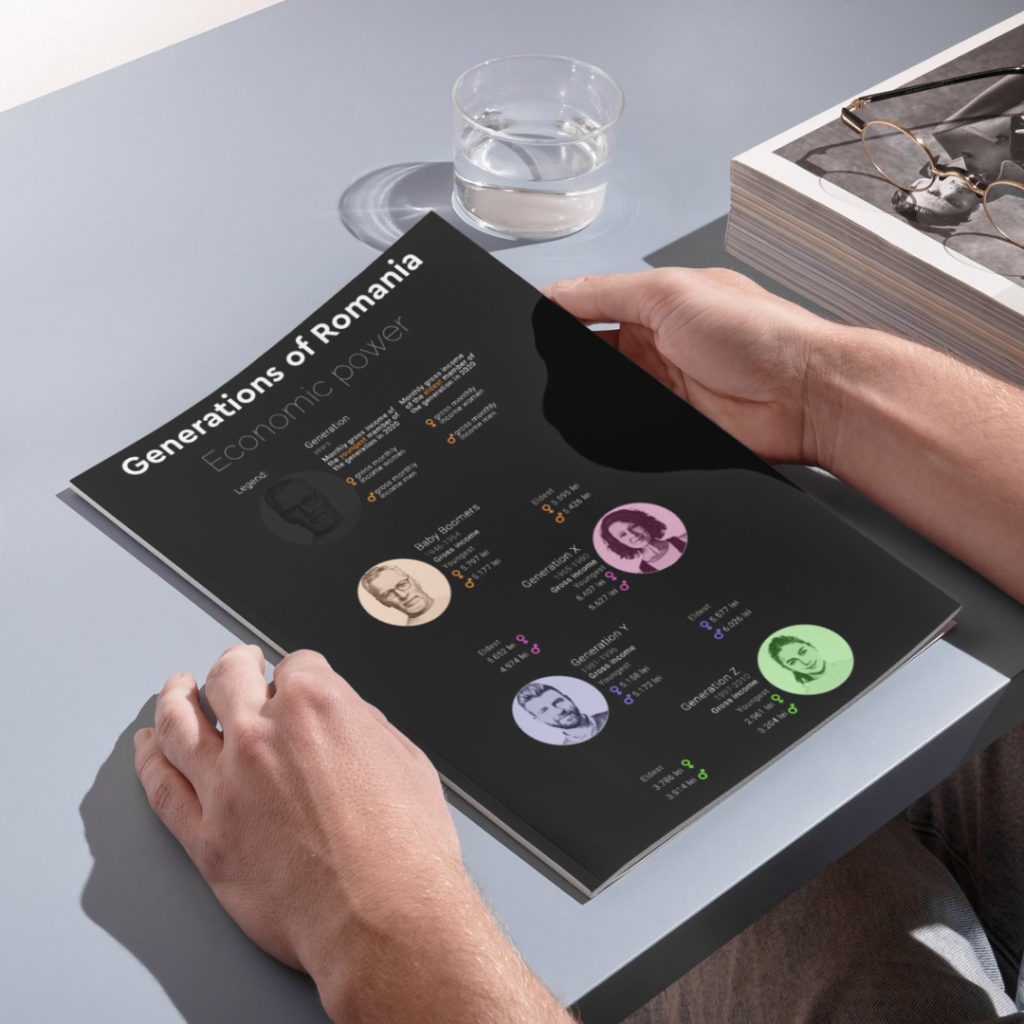
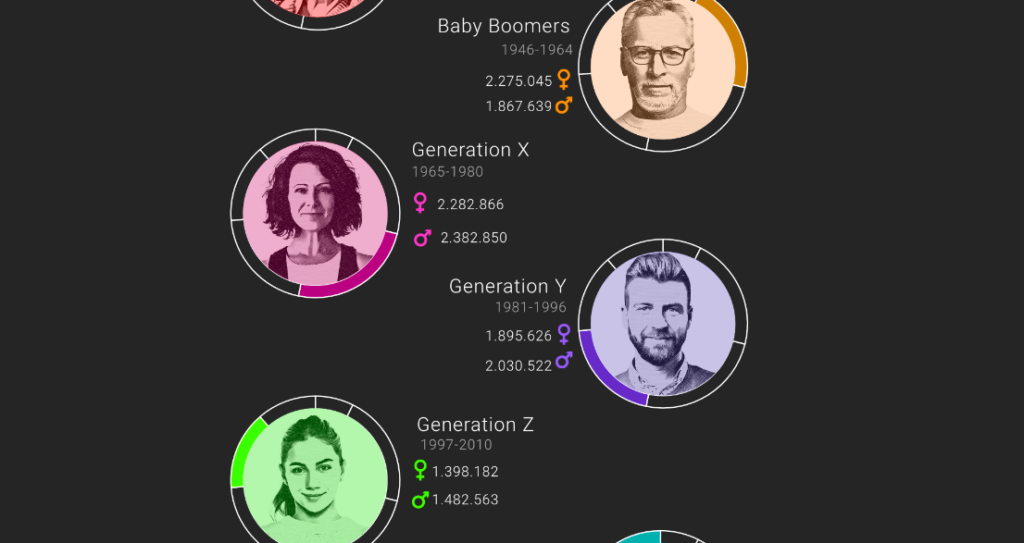
Link: Generations of Romania: The demographic, political and economic power of each generation
Color palette: