This project starts with a simple idea: not all children have the same opportunities from birth, even within the European Union. Where a child is born can shape their development and future.
I turned each child-related indicator into a storybook character to help people connect emotionally with the data. This made the statistics feel less dry and more like a story.
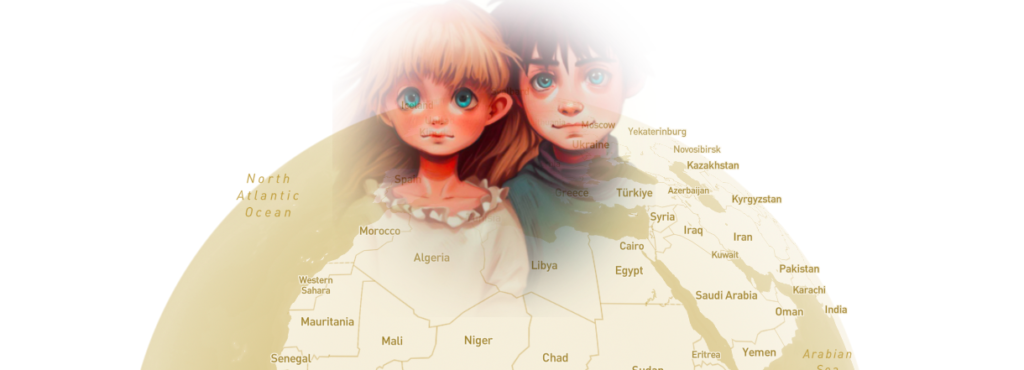
With this interactive experience, users can explore social factors that affect young people. Each indicator is linked to a well-known character from children’s books, making it easier to understand what the numbers mean for real lives.
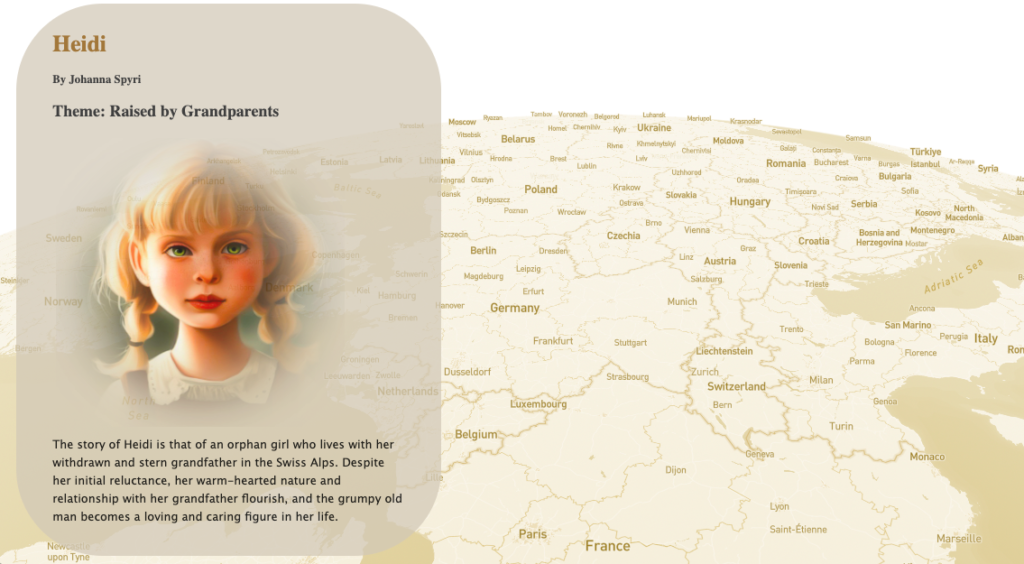
A child born in challenging circumstances might face difficulties. A child born into tough conditions might struggle like the “Little Match Girl,” lacking basic needs. Some may face poverty like Oliver Twist, or grow up without parents like Cinderella. Others, who are more fortunate, might have a childhood like Heidi, cared for by loving grandparents. Connections between cold statistics and familiar narratives foster greater empathy and understanding among readers. By humanizing the data through story characters, the visualization creates an emotional bridge, making abstract metrics more accessible and meaningful.