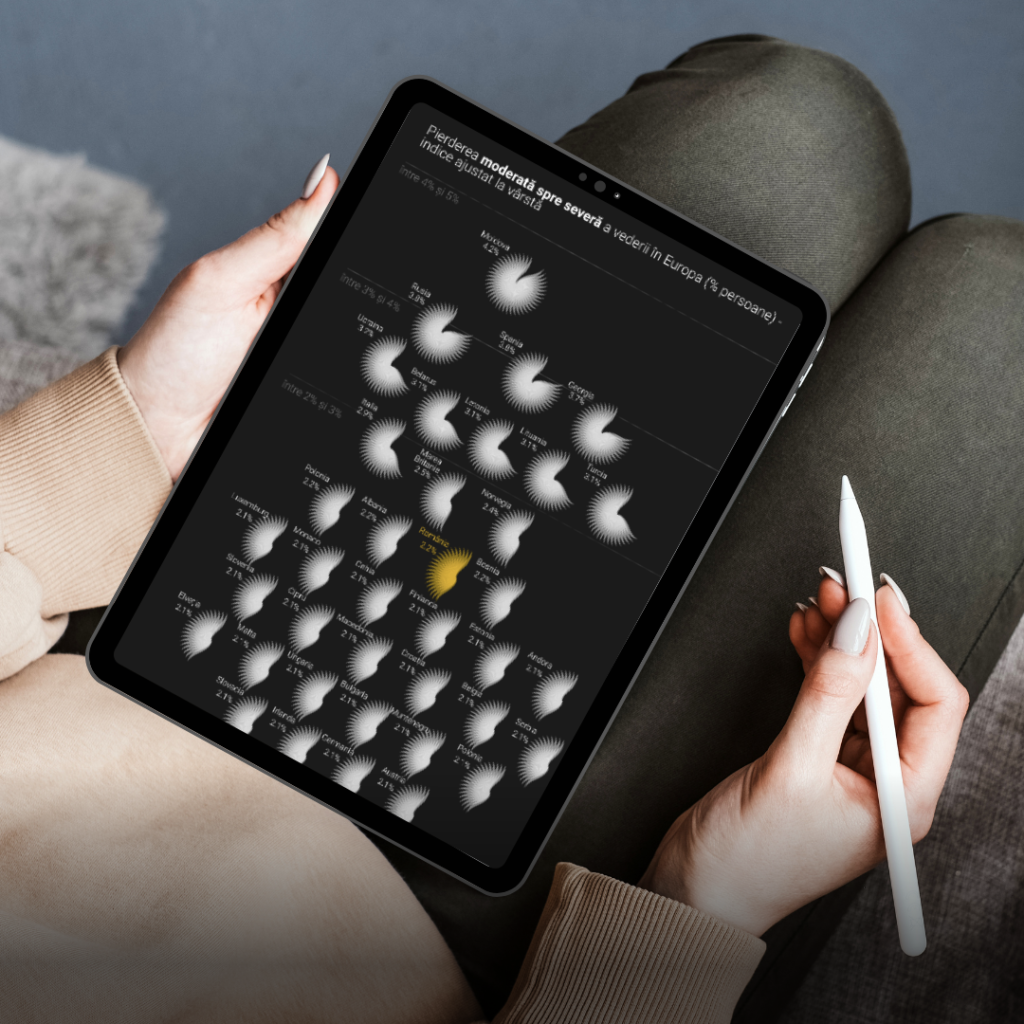
For this project, I aimed to move past just numbers and create something people could really feel. Statistics often seem abstract, and it’s easy to forget the human side when everything is reduced to percentages. That’s why I used visual metaphors to connect data with real-life experience.
Using a scrollytelling format let me take a more cinematic approach, not just for style but to help people feel more empathy. To show what myopia is like, I made blurred image effects in After Effects, exported them as JSON with Lottie, and added scroll-based animations. I also looked up tools to figure out exactly how blurry the world looks to someone with my level of vision, then adjusted the visuals to match.
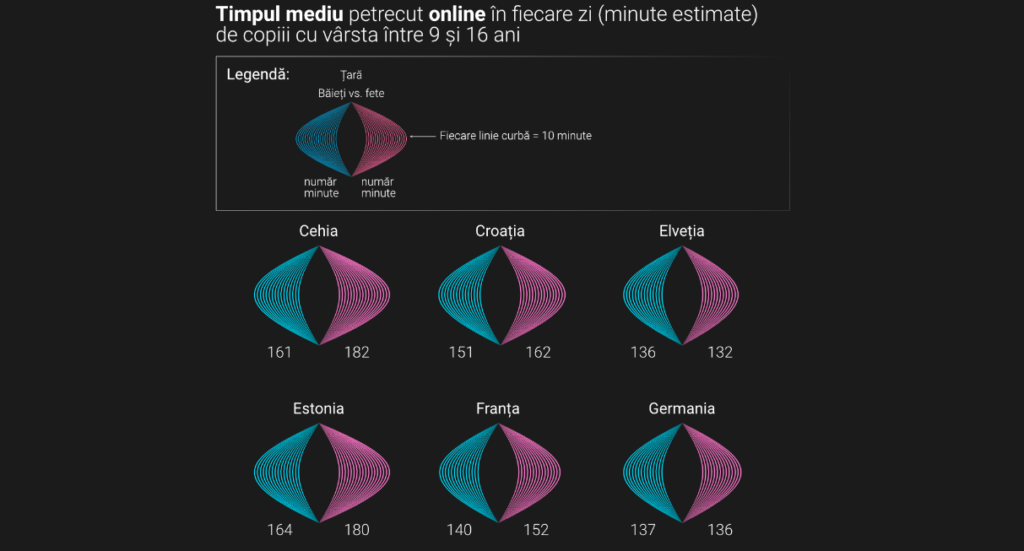
The final visualization focused more on experience than on traditional charts. My goal was to help people not just understand the data about myopia, but actually get a sense of what it feels like through visual simulation.